1: Graph views
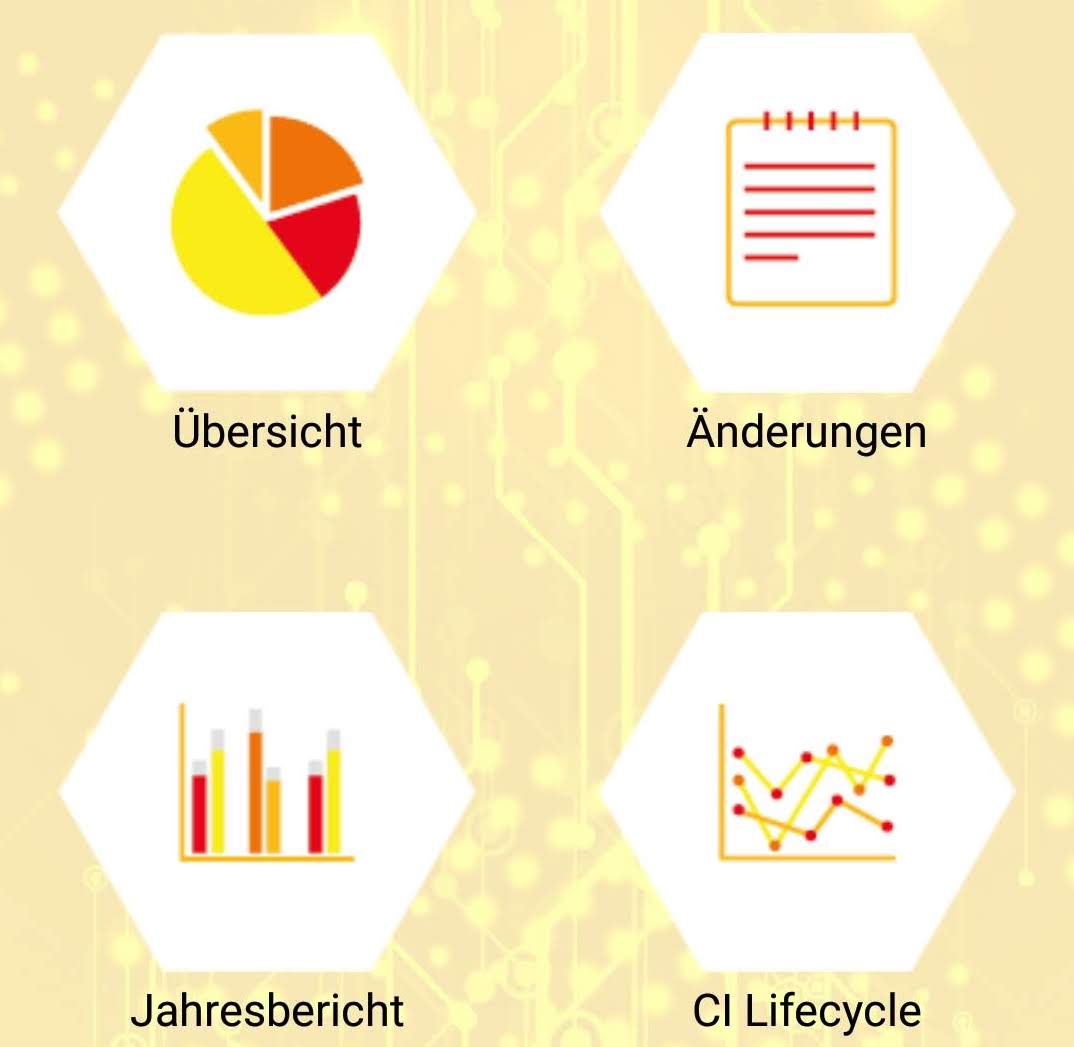
Now you can use the functionalities behind the tiles.
Overview of created objects
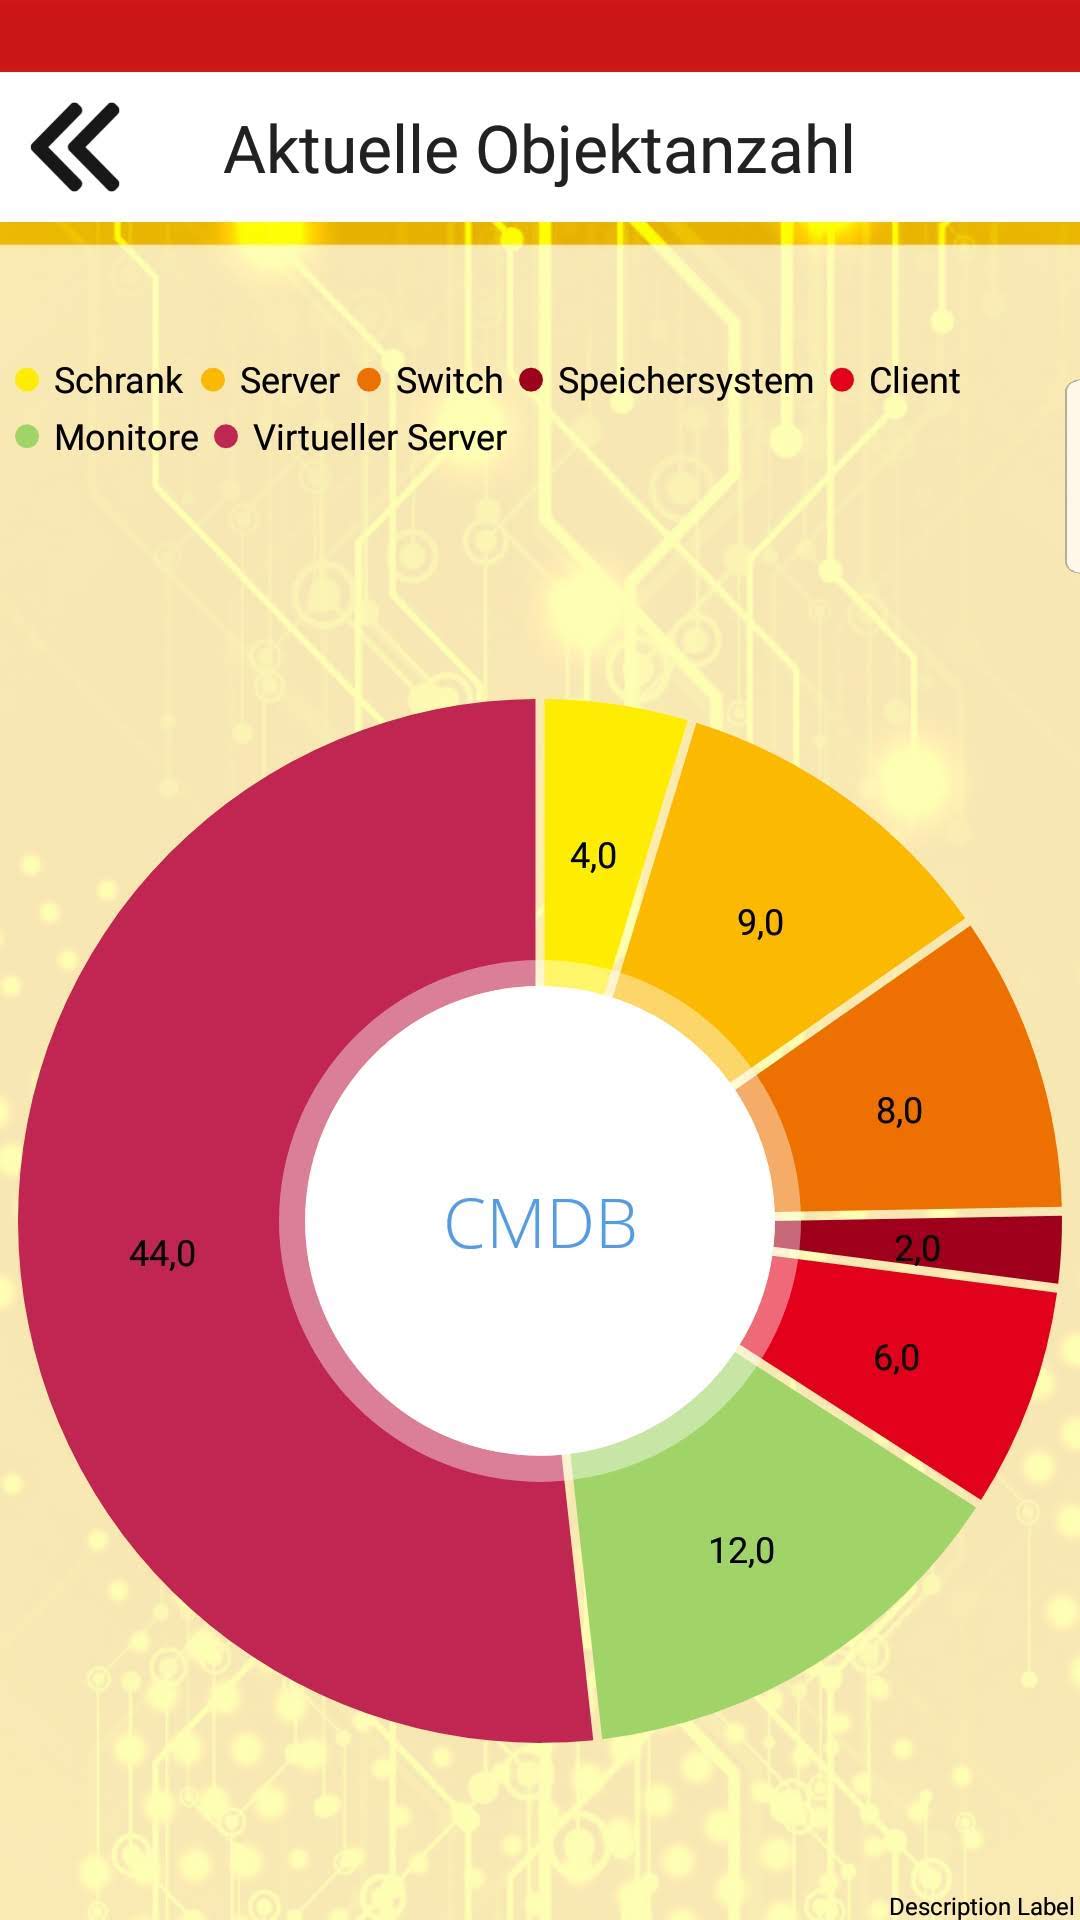
The first tile shows an overview about the current number of objects in your i-doit system. This view is pictured by a piechart diagram.
Last changes of the current year
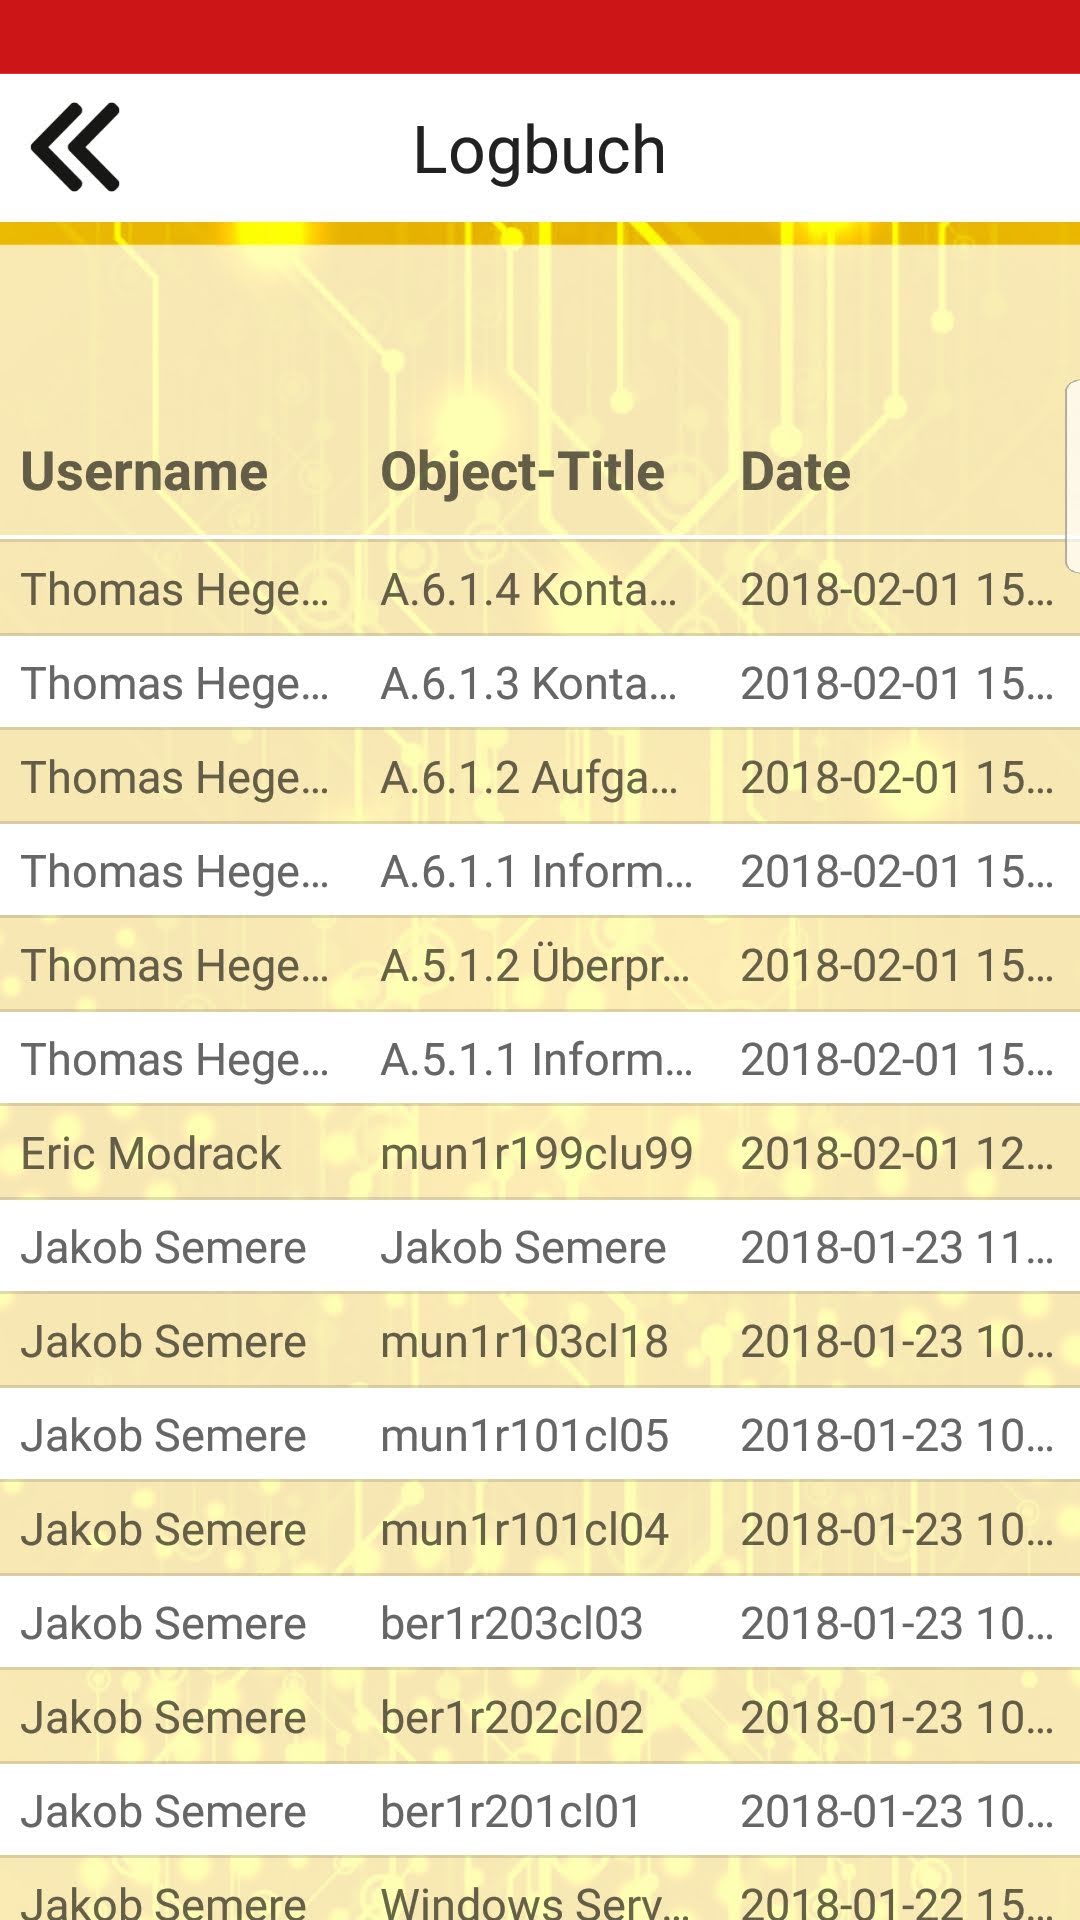
The second tile provides a list of the last changes. The range of the date can be changed in the settings. Rotate your phone to get a better view.
CMDB-Audit of the current year
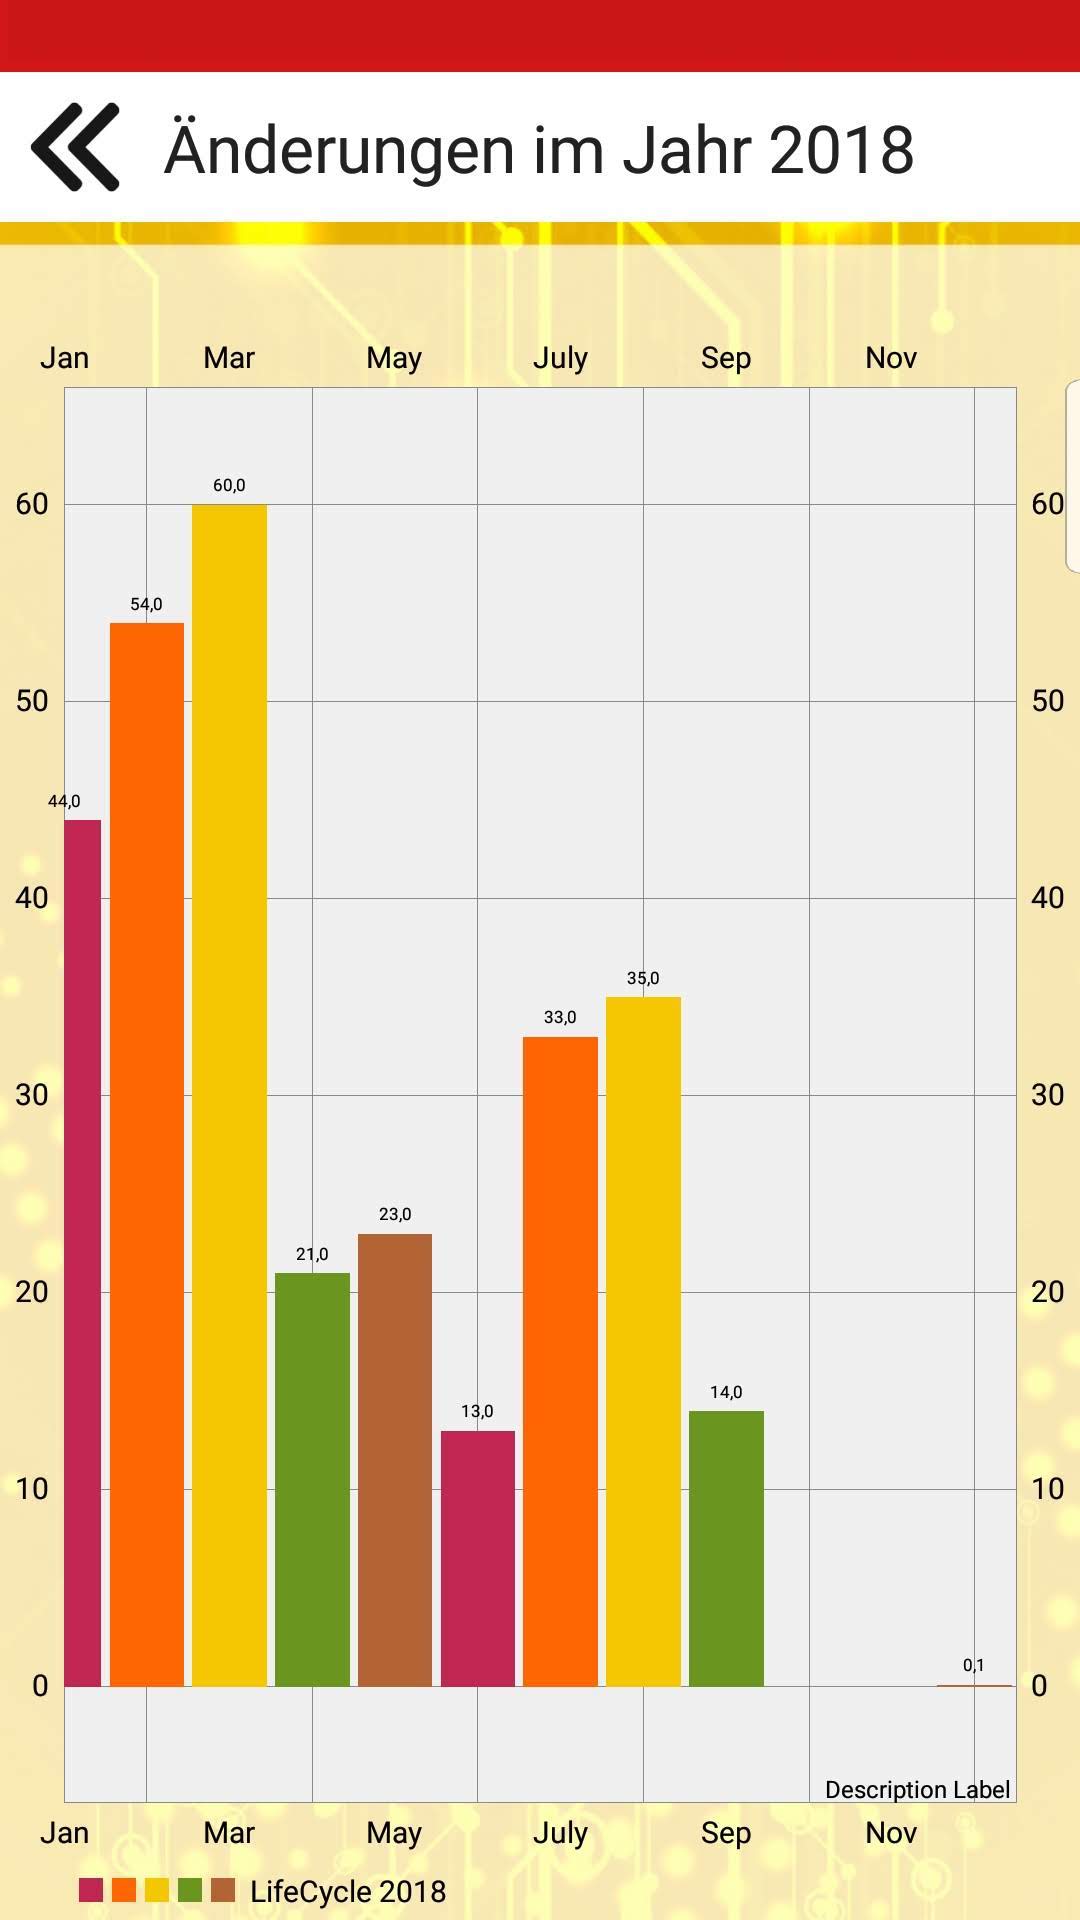
The third tile provides a list of all changes from the current year in a balk diagram.
CI-Lifecycle of the current year
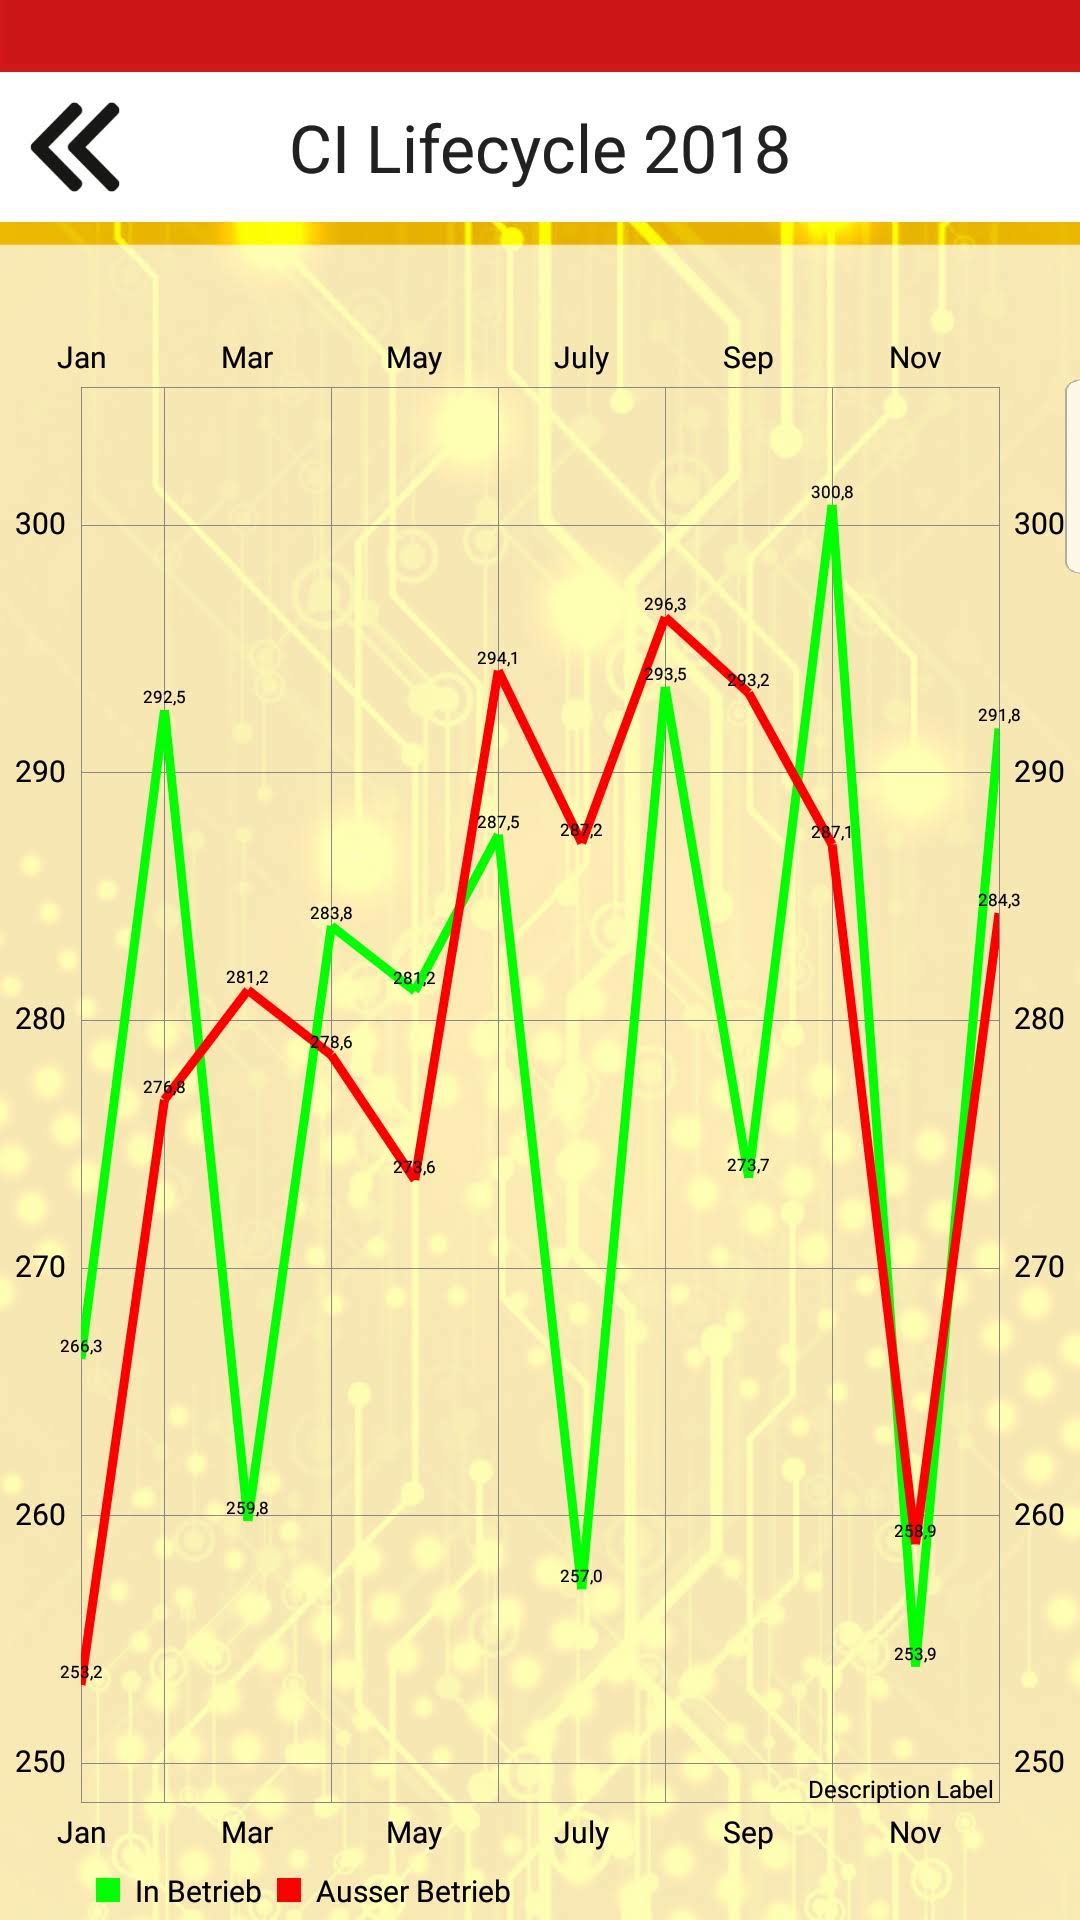
The fourth tile analyse the CI-Lifecycle from the current year. Especially the cmdb status ‘in operation’ and ‘inoperative’ will be reported by a line diagram.